If you’ve requested data counts from multiple vendors, you’ve probably received a wide range of numbers. Part of this is because each data vendor uses different sources to compile their own national consumer file. Vendors also use their own parameters to pull the data, impacting the counts. How do you compare them and select the best option for your business? While there’s many variables that can affect counts, we’ve listed a few steps to make your job easier and help you compare similar data sets.
Send an Exact Zip Code List
Before requesting counts from different data vendors, create a list of zip codes you want to target. If you say you want to target San Francisco but don’t provide specifics, you will see large discrepancies in counts. Vendor A might pull counts within the city limits of San Francisco while Vendor B might pull counts from the San Francisco Bay area. A list of zip codes keeps everyone on the same page and allows you to accurately compare data sets.
Define Terms
Each data vendor has their own way of presenting information and defining terms. Ask clarifying questions to make sure you understand the information provided. For example, let’s say you want to pull counts around a store location in 1, 5, and 10 mile radiuses. Each vendor presents their counts, and while they might look the same, they could be defined differently.
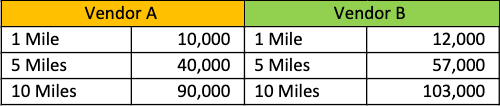
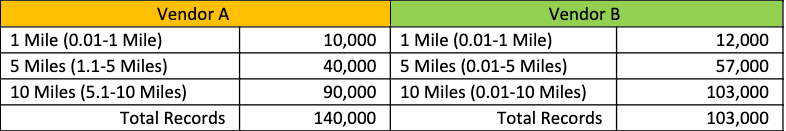
At first glance, it looks like Vendor B has more records available. However, you need to see how they define their counts. Let’s say Vendor B shows a cumulative count with their 10 miles showing all records available from 0.01-10 miles. But, Vendor A offers their counts in radius bands. This means the 1 Mile count is all available records from 0.01-1 mile, 5 Miles shows records from 1.1-5 miles, and 10 Miles count shows records from 5.1-10 miles. If Vendor A shows their counts in radius bands, then you need to add all of the radiuses together to see the total number available (10K+40K+90K = 140,000 records). Vendor A actually offers the highest count.
Demographics
Clearly state all of your target audience’s demographics such as age, income, net worth, home owners, etc. This makes sure vendors are pulling from the same universe of prospects. Note that your data suppliers might have slight differences in category definitions. One vendor might offer a category of 40-50-years-old or 50-60-years-old while another uses 45-55-years-old. While this doesn’t void your data comparison, it will create differences. Be sure to highlight demographic categories that may influence the total counts.
Data Hygiene
Another detail to pay attention to is whether or not the counts presented are mail ready. Some vendors will go ahead and run data hygiene on their counts. This includes steps like processing the counts through the National Change of Address system and running CASS, so the records are ready to mail if you select them. Other vendors will provide counts and run data hygiene after the selection has been made which will lead to a drop in total available records.
Data suppliers all have different data sources, unique compilations of national consumer files, and ways of processing their data. It’s a complex science that involves extreme attention to detail. While there’s no way to have an exact comparison between data sets, you can simplify the process of comparing data counts.
Provide each vendor with the same list of parameters. Explain who you are wanting to target and what the data is for, so your vendors can pull the highest quality of records for your specific project. If you’re not sure about the data specifics, ask clarifying questions.
If you need help comparing data counts, our team would love the opportunity to work with you. Give us a call or send us an email.